Файл:1982- Deaths from mass shootings in the U.S - scatterplot and line chart.svg

Размер этого PNG-превью для исходного SVG-файла: 800 × 600 пкс. Другие разрешения: 320 × 240 пкс | 640 × 480 пкс | 1024 × 768 пкс | 1280 × 960 пкс | 2560 × 1920 пкс | 1000 × 750 пкс.
Исходный файл (SVG-файл, номинально 1000 × 750 пкс, размер файла: 4 Кб)
Этот файл находится на Викискладе. Сведения о нём показаны ниже.
Викисклад — централизованное хранилище для свободных файлов, используемых в проектах Викимедиа.
|
Краткое описание
| Описание |
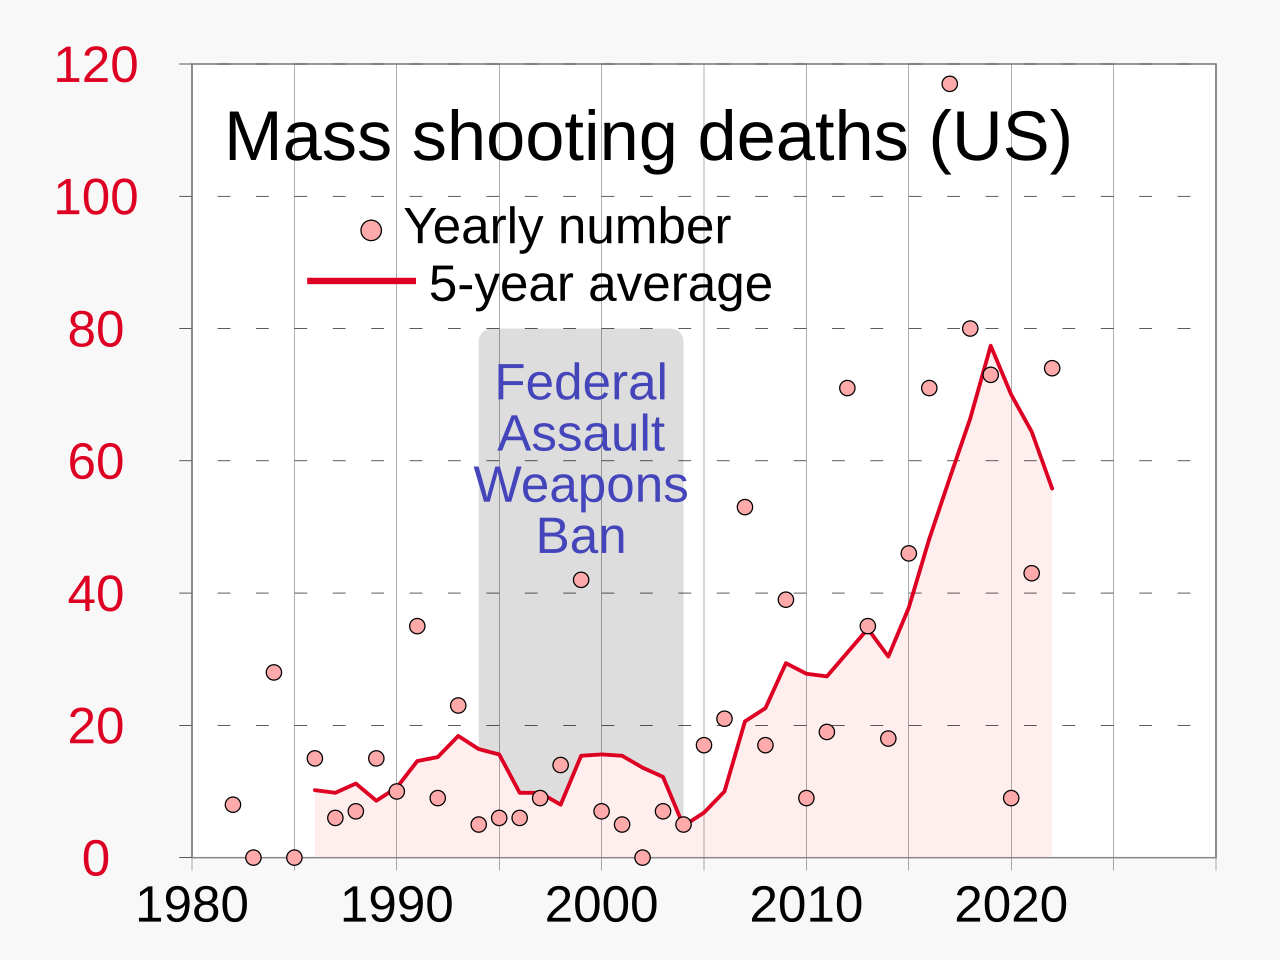
English: Chart showing deaths from mass shootings in the U.S., including 5-year moving average, beginning in 1982
|
||
| Дата | |||
| Источник | Собственная работа | ||
| Автор | RCraig09 |

Related files
-
 Predecessor PNG file
 -
 Predecessor JPG file


Лицензирование
Я, владелец авторских прав на это произведение, добровольно публикую его на условиях следующей лицензии:
Этот файл доступен по лицензии Creative Commons Attribution-Share Alike 4.0 International
- Вы можете свободно:
- делиться произведением – копировать, распространять и передавать данное произведение
- создавать производные – переделывать данное произведение
- При соблюдении следующих условий:
- атрибуция – Вы должны указать авторство, предоставить ссылку на лицензию и указать, внёс ли автор какие-либо изменения. Это можно сделать любым разумным способом, но не создавая впечатление, что лицензиат поддерживает вас или использование вами данного произведения.
- распространение на тех же условиях – Если вы изменяете, преобразуете или создаёте иное произведение на основе данного, то обязаны использовать лицензию исходного произведения или лицензию, совместимую с исходной.
История файла
Нажмите на дату/время, чтобы посмотреть файл, который был загружен в тот момент.
| Дата/время | Миниатюра | Размеры | Участник | Примечание | |
|---|---|---|---|---|---|
| текущий | 04:47, 4 апреля 2023 | | 1000 × 750 (4 Кб) | RCraig09 | Version 3: add to legend |
| 03:46, 2 апреля 2023 |  | 1000 × 750 (4 Кб) | RCraig09 | Version 2: reduce thickness of line trace to be less dominant (compatible with related charts) | |
| 21:43, 31 марта 2023 |  | 1000 × 750 (4 Кб) | RCraig09 | Uploaded own work with UploadWizard |
Использование файла
Следующая страница использует этот файл:
Глобальное использование файла
Данный файл используется в следующих вики:
- Использование в cy.wikipedia.org
- Использование в en.wikipedia.org
- Использование в en.wikiquote.org
- Использование в es.wikipedia.org
- Использование в fr.wikipedia.org
- Использование в he.wikipedia.org
- Использование в id.wikipedia.org
- Использование в it.wikipedia.org
- Использование в ja.wikipedia.org
- Использование в pl.wikipedia.org
- Использование в pt.wikipedia.org
- Использование в vi.wikipedia.org
- Использование в zh.wikipedia.org