Файл:20211109 Frequency of extreme weather for different degrees of global warming - bar chart IPCC AR6 WG1 SPM.svg

Размер этого PNG-превью для исходного SVG-файла: 800 × 450 пкс. Другие разрешения: 320 × 180 пкс | 640 × 360 пкс | 1024 × 576 пкс | 1280 × 720 пкс | 2560 × 1440 пкс | 1200 × 675 пкс.
Исходный файл (SVG-файл, номинально 1200 × 675 пкс, размер файла: 5 Кб)
Этот файл находится на Викискладе. Сведения о нём показаны ниже.
Викисклад — централизованное хранилище для свободных файлов, используемых в проектах Викимедиа.
|
Краткое описание
| Описание |
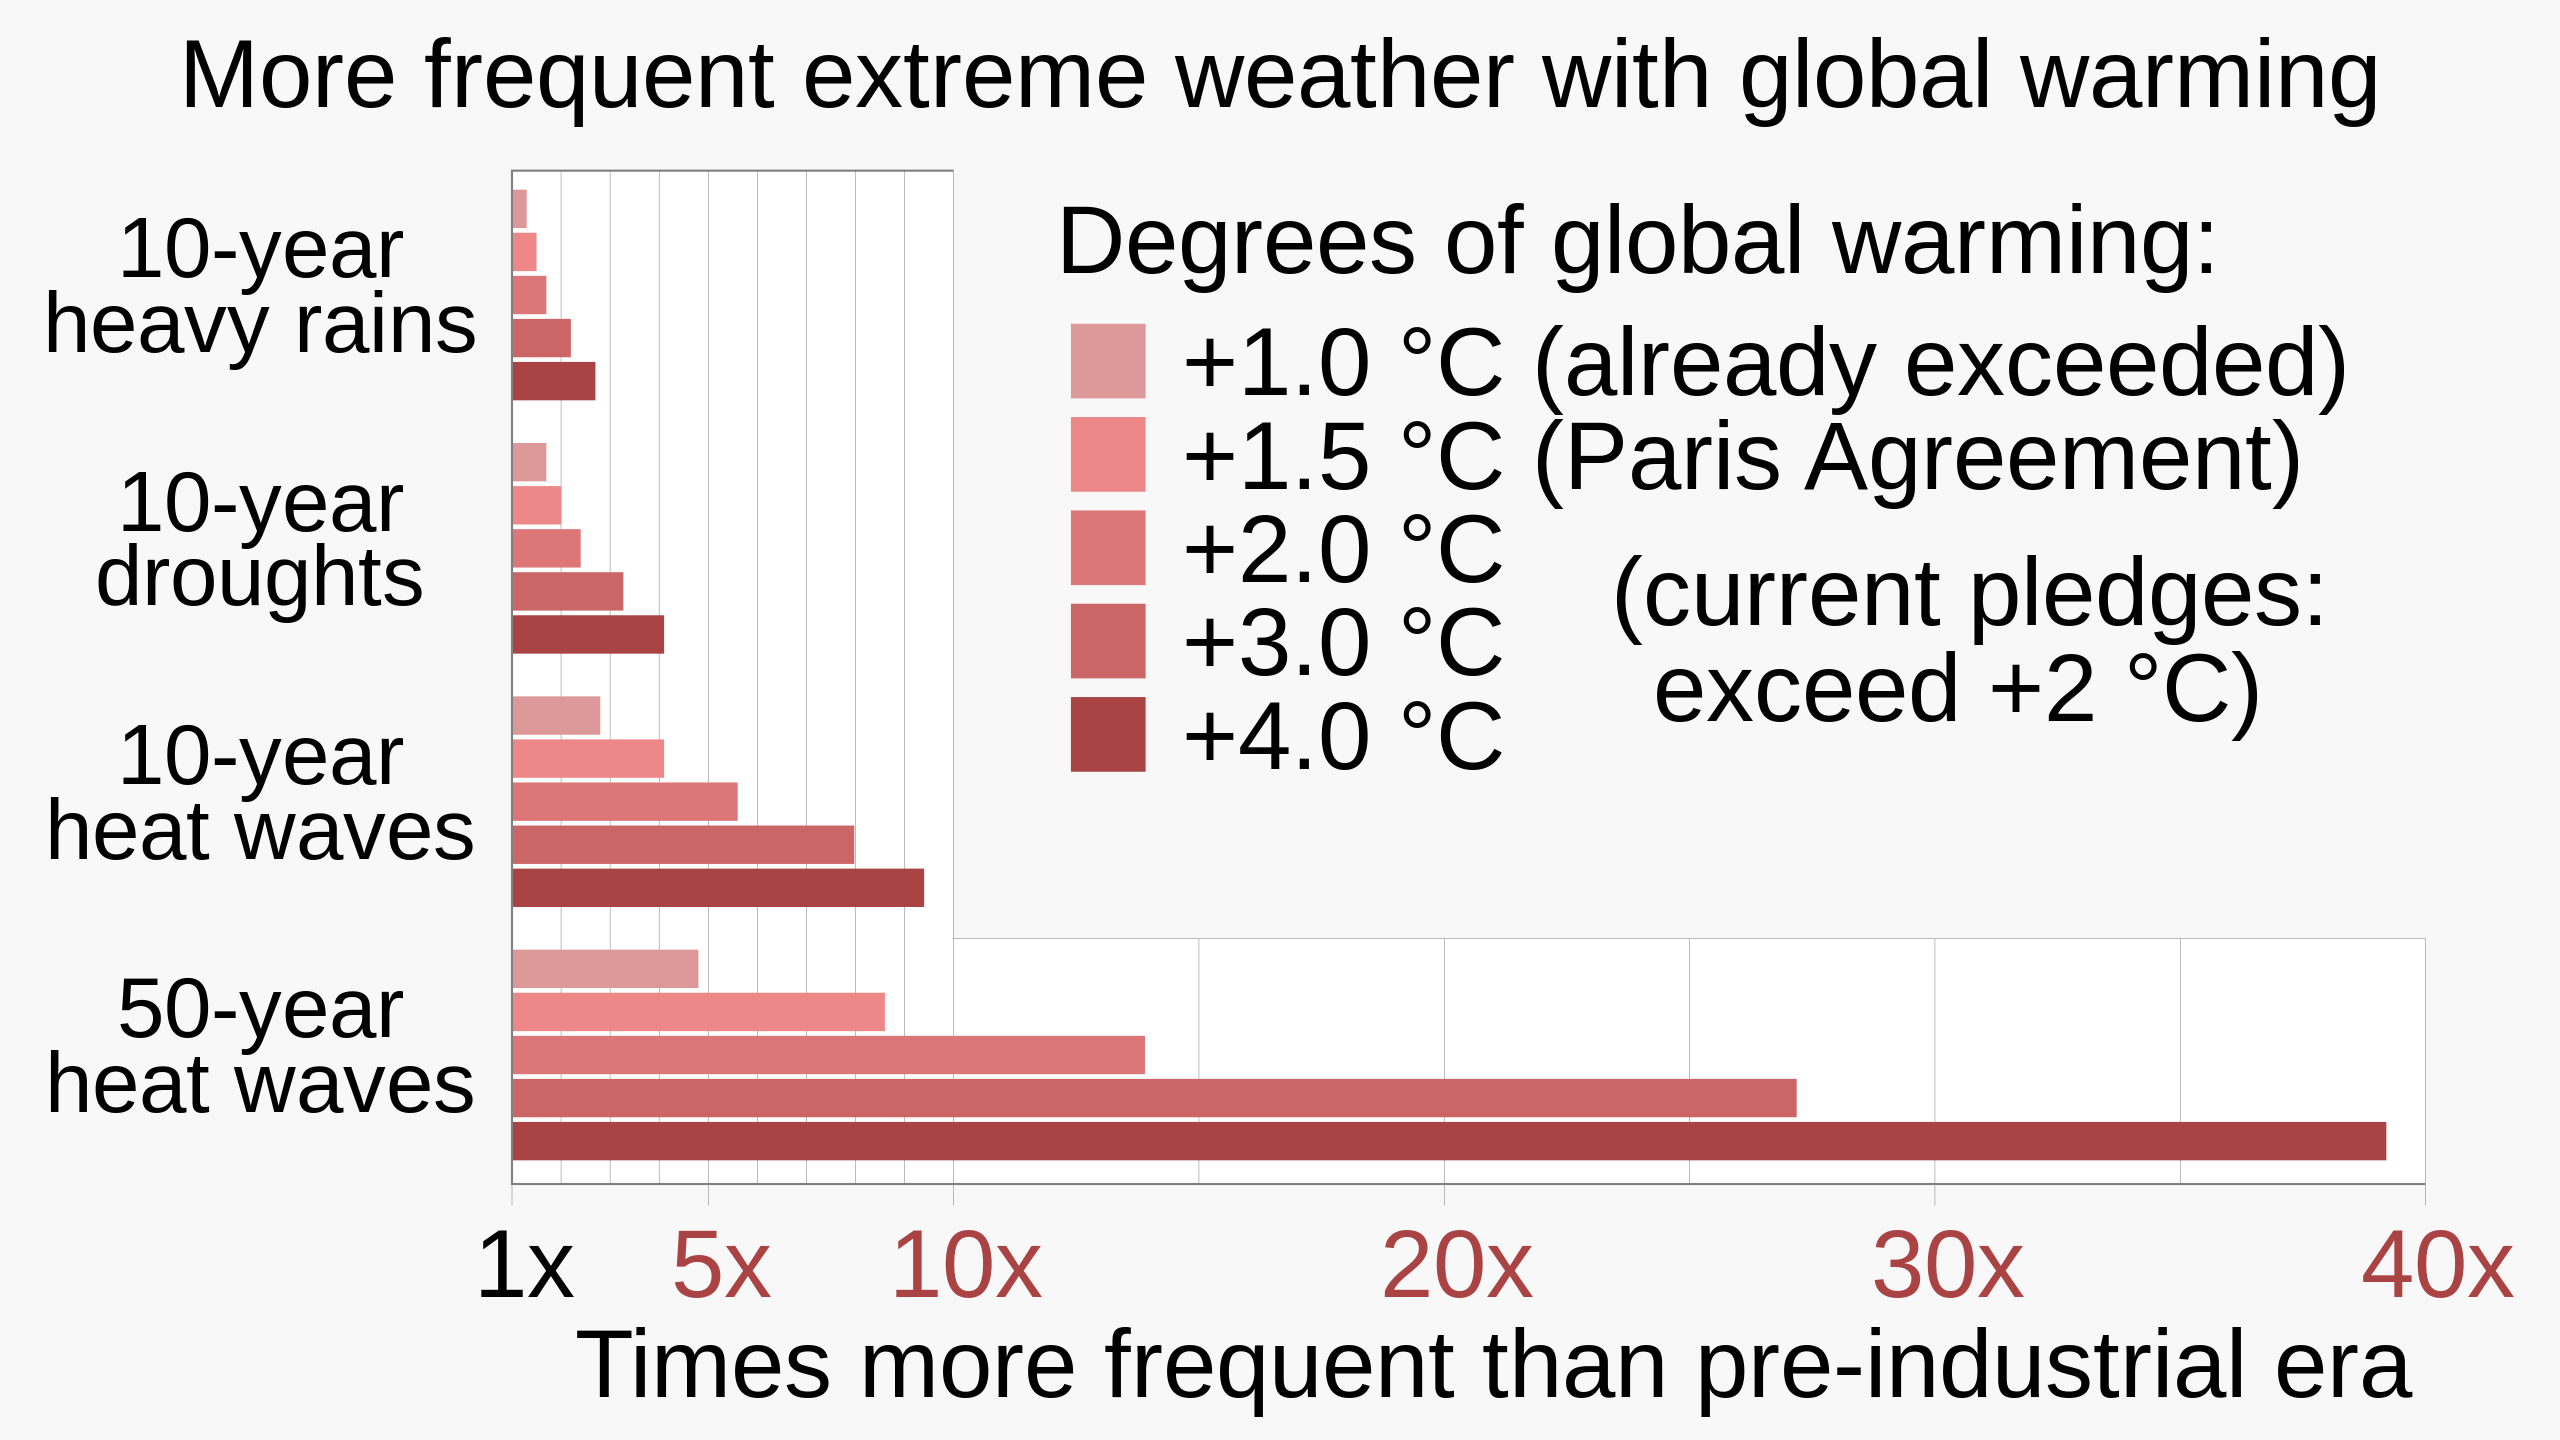
English: Bar chart showing frequency of extreme weather for different degrees of global warming, based on data from IPCC AR6 WG1 SPM (Summary for Policy Makers).
|
||||
| Дата | |||||
| Источник | Собственная работа | ||||
| Автор | RCraig09 | ||||
| Другие версии |
|


Related files
The following files are based on Fig. SPM.6 of the Sixth Assessment Report of the Intergovernmental Panel on Climate Change / Summary for Policymakers:
-
 20210809 Projected extremes for different degrees of global warming - IPCC AR6 WG1 SPM.svg
9 August 2021: Line chart of 10- and 50-year datasets (includes frequency, omits intensity) -
 20211107 Projected extremes for different degrees of global warming - 3x10yr area chart - IPCC AR6 WG1 SPM.svg
7 Nov 2021: "L" charts includes both frequency and intensity of the 10-year datasets (omits 50-year dataset) -
 20211109 Frequency of extreme weather for different degrees of global warming - bar chart IPCC AR6 WG1 SPM.svg
9 Nov 2021: Bar chart of 10- and 50-year datasets (includes frequency, omits intensity) -
 20220208 Projected temperature extremes for different degrees of global warming - orthogonal bar chart - IPCC AR6 WG1 SPM.svg
Orthogonal bar chart of 10-year heat waves (only)


Лицензирование
Я, владелец авторских прав на это произведение, добровольно публикую его на условиях следующей лицензии:
Этот файл доступен по лицензии Creative Commons Attribution-Share Alike 4.0 International
- Вы можете свободно:
- делиться произведением – копировать, распространять и передавать данное произведение
- создавать производные – переделывать данное произведение
- При соблюдении следующих условий:
- атрибуция – Вы должны указать авторство, предоставить ссылку на лицензию и указать, внёс ли автор какие-либо изменения. Это можно сделать любым разумным способом, но не создавая впечатление, что лицензиат поддерживает вас или использование вами данного произведения.
- распространение на тех же условиях – Если вы изменяете, преобразуете или создаёте иное произведение на основе данного, то обязаны использовать лицензию исходного произведения или лицензию, совместимую с исходной.
История файла
Нажмите на дату/время, чтобы посмотреть файл, который был загружен в тот момент.
| Дата/время | Миниатюра | Размеры | Участник | Примечание | |
|---|---|---|---|---|---|
| текущий | 20:44, 29 июля 2023 | | 1200 × 675 (5 Кб) | RCraig09 | Version 12: remove <tspan> declarations embedded within <text> in the title "More frequent...", to work around ongoing text rendering problems on Wikimedia |
| 20:29, 29 июля 2023 |  | 1200 × 675 (5 Кб) | RCraig09 | Version 11: manually changing "+1.1 °C today" to "(already exceeded)" (in the English language portion) to future-proof this graphic . . . . retained JP translation <switch> elements without change | |
| 04:57, 6 сентября 2022 |  | 1200 × 675 (5 Кб) | Icosohedral | File uploaded using svgtranslate tool (https://svgtranslate.toolforge.org/). Added translation for zh. | |
| 17:19, 21 декабря 2021 |  | 1200 × 675 (3 Кб) | RCraig09 | Version 9: misc changes per suggestions on this file's Talk page. | |
| 05:31, 22 ноября 2021 |  | 1200 × 675 (3 Кб) | RCraig09 | Version 8: more exact 3.0 C values . . . colors of horizontal axis tick labels | |
| 03:40, 18 ноября 2021 |  | 1200 × 675 (3 Кб) | RCraig09 | Version 7: adding to legend, 2.7 C under current pledges, per discussions at en.wp's Talk:Climate change | |
| 04:58, 17 ноября 2021 |  | 1200 × 675 (4 Кб) | RCraig09 | Version 6: Enlarge some font sizes . . . . change some text | |
| 06:07, 16 ноября 2021 |  | 1200 × 675 (4 Кб) | RCraig09 | Version 5: Used Liberation Sans . . . changed legend to "Present-day =+1.1 C" | |
| 18:25, 13 ноября 2021 |  | 1200 × 675 (4 Кб) | RCraig09 | Version 4: includes thinner, white vertical gridlines that overlay the colored bars, to make it easier to determine extent of the bars. Darker, wider gridlines remain behind the gridlines so they're visible over the white background. | |
| 04:21, 13 ноября 2021 |  | 1200 × 675 (4 Кб) | RCraig09 | Version 3: reduced length of some vertical grid lines; removed most of the plot-area outline. |
Использование файла
Следующая страница использует этот файл:
Глобальное использование файла
Данный файл используется в следующих вики:
- Использование в bn.wikipedia.org
- Использование в de.wikipedia.org
- Использование в en.wikipedia.org
- Использование в eo.wikipedia.org
- Использование в ko.wikipedia.org
- Использование в ms.wikipedia.org
- Использование в pt.wikipedia.org
- Использование в rw.wikipedia.org
- Использование в tr.wikipedia.org
- Использование в zh.wikipedia.org