Файл:Butterworth filter bode plot.png

Размер этого предпросмотра: 800 × 560 пкс. Другие разрешения: 320 × 224 пкс | 640 × 448 пкс | 1024 × 717 пкс | 1250 × 875 пкс.
Исходный файл (1250 × 875 пкс, размер файла: 110 КБ, MIME-тип: image/png)
Этот файл находится на Викискладе. Сведения о нём показаны ниже.
Викисклад — централизованное хранилище для свободных файлов, используемых в проектах Викимедиа.
|
Краткое описание
| Описание |
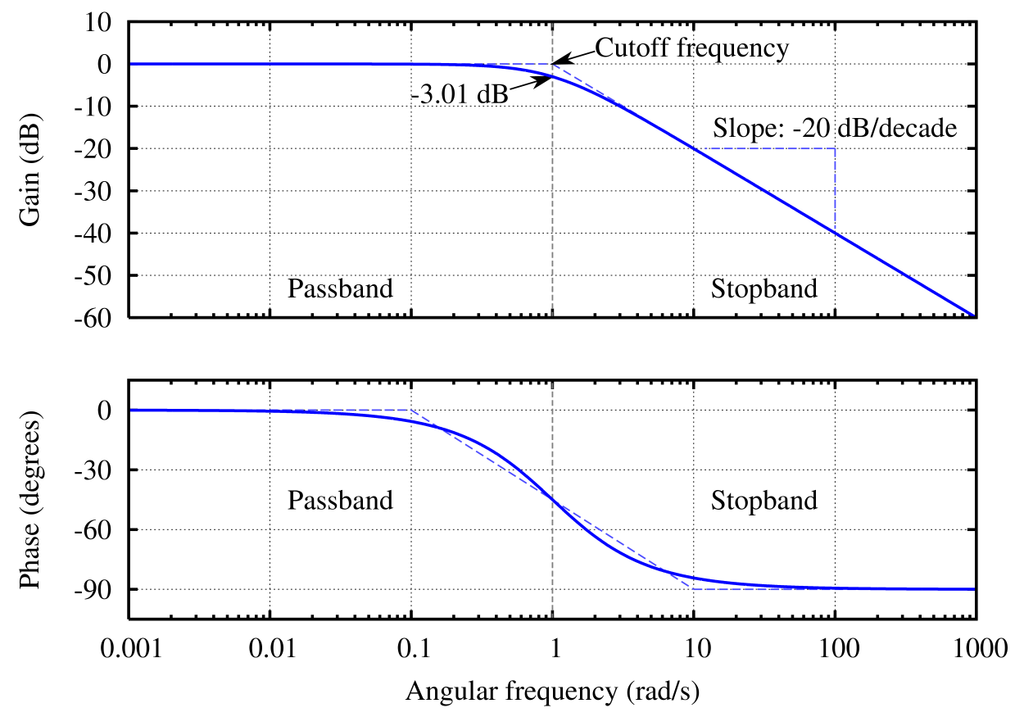
English: The Bode plot of a Butterworth filter with logarithmic axes and various labels. Cutoff frequency is normalized to 1 rad/s. Gain is normalized to 0 dB in the passband. Phase is in degrees because that's typical. The code is kind of kludgy, but makes a good output. See Wikipedia graph-making tips. Generated in gnuplot with the script below (save as butterworth_bode_plot.plt and then open in gnuplot). Then I opened the butterworth_bode_plot.ps file in a text editor to edit the line colors and linestyles, as per this description. This avoids needing to open in proprietary software, and really isn't that difficult (especially if you don't know the commands in the proprietary software either). ;-) Identify the lines easily by their color (the arrow is currently magenta and I want it to be black. Ah, there is the entry with 1 0 1, red + blue = magenta) or by using the gnuplot linestyle−1. (For instance, gnuplot's linestyle 3 corresponds to the ps file's /LT2.) Then you can edit the colors and dashes by hand. I changed the original: /LT0 { PL [] 1 0 0 DL } def
/LT1 { PL [4 dl 2 dl] 0 1 0 DL } def
/LT2 { PL [2 dl 3 dl] 0 0 1 DL } def
/LT3 { PL [1 dl 1.5 dl] 1 0 1 DL } def
into this: /LT0 { PL [] 0 0 1 DL } def
/LT1 { PL [4 dl 2 dl] 0.5 0.5 0.5 DL } def
/LT2 { PL [6 dl 3 dl] 0.3 0.3 1 DL } def
/LT3 { PL [] 0 0 0 DL } def
/LT4–/LT8 I left unchanged. (I don't know what they're used for anyway.) /LTw, /LTb, and /LTa are for the grid lines and such. To convert the PostScript file to PNG:
Это plot было создано с помощью Gnuplot. |
| Дата | 8 октября 2005 (дата загрузки) |
| Источник | Собственная работа |
| Автор | Omegatron |
| Другие версии |
[]
.png:
|
| gnuplot source | click to expand
set samples 2001
set terminal postscript enhanced landscape color lw 2 "Times-Roman" 20
set output "butterworth bode plot.ps"

# Butterworth amplitude response and decibel calculation.  n is the order, which is just 1 in this image.
G(w,n) = 1 / (sqrt(1 + w**(2*n)))
dB(x) = 20 * log10(abs(x))
# Phase is for first order
P(w) = -pi/2-atan(1.2*w)-atan(0.09*w)

# Gridlines
set grid

# Set x axis to logarithmic scale
set logscale x 10

# No need for a key
set nokey #0.1,-25

# Frequency response's line plotting style
set style line 1 lt 1 lw 2

# Asymptote lines and slope lines are the same "arrow" style
set style line 3 lt 3 lw 1
set style arrow 3 nohead ls 3

# -3 dB arrow style
set style line 4 lt 4 lw 1
set style arrow 4 head filled size screen 0.02,15,45 ls 4

# Separator between passband and stopband line style
set style line 2 lt 2 lw 1
set style arrow 2 nohead ls 2

set multiplot

# Magnitude response
# =============================================
set size 1,0.5
set origin 0,0.5

# Set range of x and y axes
set xrange [0.001:1000]
set yrange [-60:10]

# Create x-axis tic marks once per decade (every multiple of 10)
set xtics 10
#set ytics 10

# No need for two sets of numbers
set format x ""

# Use 10 x-axis minor divisions per major division
set mxtics 10

# Axis labels
set ylabel "Gain (dB)"

# Draw asymptote lines
set arrow 1 from 1,0 to 1000,-60 as 3
set arrow 2 from .001,0 to 1,0 as 3

# -3 dB arrow
set arrow 4 from 2,3 to 1,0 as 4

# "Cutoff frequency" label uses same coordinates as the function
set label 3 "Cutoff frequency" at 2,4 l

# "-3 dB" label
set arrow 5 from 0.5,-6 to 1,-3 as 4
set label 4 "-3.01 dB" at 0.5,-7 r

# Draw a separator between passband and stopband and label them
set arrow 3 from 1,-60 to 1,10 as 2

# Label coordinates are relative to the graph window, not to the function, centered at the 1/4 and 3/4 width points
set label 1 "Passband" at graph 0.25, graph 0.1 c
set label 2 "Stopband" at graph 0.75, graph 0.1 c

# Draw slope lines and label
set arrow 6 from 100,-20 to 12,-20 as 3
set arrow 7 from 100,-20 to 100,-39 as 3
set label 5 "Slope: -20 dB/decade" at 100,-15 c

plot dB(G(x,1)) ls 1  title "1st-order response"

#Phase response
# =============================================
set size 1,0.5
set origin 0,0

# Set range of x and y axes
set yrange [-105:15]

# Create y-axis tic marks every 15 degrees
set ytics 30

# Regular numbers
set format x "% g"

# Axis labels
set ylabel "Phase (degrees)"
set xlabel "Angular frequency (rad/s)"

# Draw asymptote lines
set arrow 1 from 0.1,0 to 10,-90 as 3
set arrow 2 from 0.001,0 to 0.1,0 as 3
set arrow 10 from 10,-90 to 1000,-90 as 3

# -3 dB arrow
unset arrow 4 #from 2,3 to 1,0 as 4

# "Cutoff frequency" label uses same coordinates as the function
unset label 3 #"Cutoff frequency" at 2,4 l

# "-3 dB" label
unset arrow 5 #from 0.5,-6 to 1,-3 as 4
unset label 4 #"-3.01 dB" at 0.5,-7 r

# Draw a separator between passband and stopband and label them
set arrow 3 from 1,-105 to 1,15 as 2

# Label coordinates are relative to the graph window, not to the function, centered at the 1/4 and 3/4 width points
set label 1 "Passband" at graph 0.25, graph 0.5 c
set label 2 "Stopband" at graph 0.75, graph 0.5 c

# Draw slope lines and label
unset arrow 6 #from 100,-20 to 12,-20 as 3
unset arrow 7 #from 100,-20 to 100,-39 as 3
unset label 5 #"Slope: -20 dB/decade" at 100,-18 c

plot P(x) ls 1 title "Phase response"

unset multiplot
|


|
Существует векторная версия этого изображения. Её следует использовать, если качество её не хуже, чем эта растровая версия.
File:Butterworth filter bode plot.png → File:Butterworth filter bode plot.svg
Подробнее о векторной графике в статье «Перевод изображений в формат SVG». Также доступна информация о поддержке формата SVG в MediaWiki. |
 |
Лицензирование
Я, владелец авторских прав на это произведение, добровольно публикую его на условиях следующих лицензий:
Этот файл доступен на условиях лицензий Creative Commons Attribution-Share Alike 3.0 Unported, 2.5 Generic, 2.0 Generic и 1.0 Generic.
- Вы можете свободно:
- делиться произведением – копировать, распространять и передавать данное произведение
- создавать производные – переделывать данное произведение
- При соблюдении следующих условий:
- атрибуция – Вы должны указать авторство, предоставить ссылку на лицензию и указать, внёс ли автор какие-либо изменения. Это можно сделать любым разумным способом, но не создавая впечатление, что лицензиат поддерживает вас или использование вами данного произведения.
- распространение на тех же условиях – Если вы изменяете, преобразуете или создаёте иное произведение на основе данного, то обязаны использовать лицензию исходного произведения или лицензию, совместимую с исходной.

|
Разрешается копировать, распространять и/или изменять этот документ в соответствии с условиями GNU Free Documentation License версии 1.2 или более поздней, опубликованной Фондом свободного программного обеспечения, без неизменяемых разделов, без текстов, помещаемых на первой и последней обложке. Копия лицензии включена в раздел, озаглавленный GNU Free Documentation License. |
Вы можете выбрать любую из этих лицензий.
История файла
Нажмите на дату/время, чтобы посмотреть файл, который был загружен в тот момент.
| Дата/время | Миниатюра | Размеры | Участник | Примечание | |
|---|---|---|---|---|---|
| текущий | 20:01, 8 октября 2005 | | 1250 × 875 (110 КБ) | Omegatron | last revision? |
| 19:41, 8 октября 2005 |  | 1250 × 875 (113 КБ) | Omegatron | better | |
| 19:30, 8 октября 2005 |  | 1250 × 875 (117 КБ) | Omegatron | The frequency response of a Butterworth filter with logarithmic axes (Bode plot) and various labels. Cutoff frequency is normalized to 1 rad/s. Gain is |
Использование файла
Нет страниц, использующих этот файл.
Глобальное использование файла
Данный файл используется в следующих вики:
- Использование в eo.wikipedia.org
- Использование в eu.wikipedia.org
- Использование в fr.wikipedia.org
- Использование в he.wikipedia.org
- Использование в hi.wikipedia.org
- Использование в nn.wikipedia.org
- Использование в pl.wikipedia.org
- Использование в pt.wikipedia.org
- Использование в zh.wikipedia.org