Файл:Estimations of Human Brain Emulation Required Performance.svg

Размер этого PNG-превью для исходного SVG-файла: 800 × 600 пкс. Другие разрешения: 320 × 240 пкс | 640 × 480 пкс | 1024 × 768 пкс | 1280 × 960 пкс | 2560 × 1920 пкс.
Исходный файл (SVG-файл, номинально 800 × 600 пкс, размер файла: 49 Кб)
Этот файл находится на Викискладе. Сведения о нём показаны ниже.
Викисклад — централизованное хранилище для свободных файлов, используемых в проектах Викимедиа.
|
Краткое описание
| Описание |
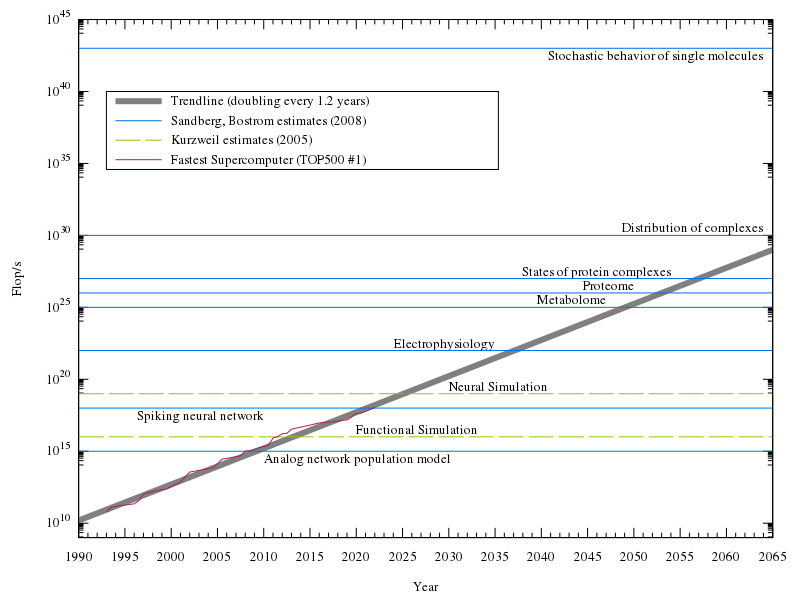
English: Estimates of how much processing power is needed to emulate a human brain at various levels, along with the fastest supercomputer from TOP500 mapped by year, and a trendline. Exponential plot, with assumption of doubling of computational power every 1.1 years for the trendline. |
| Дата | |
| Источник | Собственная работа, data from [1], PPTSuperComputersPRINT.jpg, and [2]. |
| Автор | Tga.D |
| SVG‑разработка | Этот файл использует переводимый встроенный текст. |
| Исходный код | Gnuplot codeset terminal svg size 800 600 fname "Times,13"
set output "Estimations of Human Brain Emulation Required Performance.svg"
set notitle
set key reverse Left left at 1993, 10**40 noautotitles box # good chunk of whitespace to put the key in
set datafile separator ","
set logscale y # use a logarithmic scale, for easier visualization of exponential growth
set format y "10^{%T}"
set yrange[10**9:10**45]
set ylabel "Flop/s"
set xrange [1990:2065]
set xlabel "Year"
set xtics 1990,5,2065
set mxtics 5
#set grid # I think it looks better without, but it's a matter of preference
# labels for each of the levels of emulation
set label "Analog network population model" at 2010, 10**14.5 left
set label "Spiking neural network" at 2010, 10**17.5 right
set label "Electrophysiology" at 2035, 10**22.5 right
set label "Metabolome" at 2047, 10**25.5 right
set label "Proteome" at 2050, 10**26.5 right
set label "States of protein complexes" at 2054, 10**27.5 right
set label "Distribution of complexes" at 2064, 10**30.5 right
set label "Stochastic behavior of single molecules" at 2064, 10**42.5 right
set label "Functional Simulation" at 2020, 10**16.5 left
set label "Neural Simulation" at 2030, 10**19.5 left
# best-fit is as of June 2022 list, to two sigfigs
# horizontal lines plotted to represent levels of emulation
# plot of historical TOP500 #1's stored in a .csv
# colors and sizes picked from what I thought was easiest to see
# titles done for one of each type of line, for the key
plot 87000000000.0*(2**((x-1993)/1.2)) lw 6 lc 0 w lines title "Trendline (doubling every 1.2 years)",\
10**15 ls 3 lt rgb "#0073E6", \
10**18 ls 3 lt rgb "#0073E6", \
10**22 ls 3 lt rgb "#0073E6", \
10**25 ls 3 lt rgb "#0073E6", \
10**26 ls 3 lt rgb "#0073E6", \
10**27 ls 3 lt rgb "#0073E6", \
10**30 ls 3 lt rgb "#0073E6", \
10**43 ls 3 lt rgb "#0073E6" title "Sandberg, Bostrom estimates (2008)",\
10**16 ls 2 dt (50,10) lc rgb "#89CE00", \
10**19 ls 2 dt (50,10) lt rgb "#89CE00" title "Kurzweil estimates (2005)",\
"TOP500.csv" using 1:2 ls 1 lt rgb "#B51963" pt 7 ps .5 with linespoints title "Fastest Supercomputer (TOP500 #1)"
DataThe #1 computer over the years from TOP500, used to generate the supercomputer line at the end of the Gnuplot code. The name of each supercomputer is in the file, but unused in the code/chart. Whole number years represent a June list, .5 represents a November list.
Year,Flop/s,Name
1993,59700000000,CM-5/1024
1993.5,124000000000,Numerical Wind Tunnel
1994,143400000000,XP/S140
1994.5,170000000000,Numerical Wind Tunnel
1996,220400000000,SR2201/1024
1996.5,368200000000,CP-PACS/2048
1997,1068000000000,ASCI Red
1997.5,1338000000000,ASCI Red
1999,2121000000000,ASCI Red
1999.5,2379000000000,ASCI Red
2000.5,4938000000000,ASCI White
2001,7226000000000,ASCI White
2002,35860000000000,Earth-Simulator
2004.5,70720000000000,BlueGene/L beta-System
2005,136800000000000,BlueGene/L
2005.5,280600000000000,BlueGene/L
2007.5,478200000000000,BlueGene/L
2008,1026000000000000,Roadrunner
2008.5,1105000000000000,Roadrunner
2009.5,1759000000000000,Jaguar
2010.5,2566000000000000,Tianhe-1A
2011,8162000000000000,K computer
2011.5,10510000000000000,K computer
2012,16324800000000000,Sequoia
2012.5,17590000000000000,Titan
2013,33862700000000000,Tianhe-2A
2016,93014600000000000,Sunway TaihuLight
2018,122300000000000000,Summit
2018.5,143500000000000000,Summit
2020,415530000000000000,Fugaku
2020.5,442000000000000000,Fugaku
2022,1102000000000000000,Frontier
|
Лицензирование
Я, владелец авторских прав на это произведение, добровольно публикую его на условиях следующей лицензии:
Этот файл доступен по лицензии Creative Commons Attribution-Share Alike 3.0 Unported.
- Вы можете свободно:
- делиться произведением – копировать, распространять и передавать данное произведение
- создавать производные – переделывать данное произведение
- При соблюдении следующих условий:
- атрибуция – Вы должны указать авторство, предоставить ссылку на лицензию и указать, внёс ли автор какие-либо изменения. Это можно сделать любым разумным способом, но не создавая впечатление, что лицензиат поддерживает вас или использование вами данного произведения.
- распространение на тех же условиях – Если вы изменяете, преобразуете или создаёте иное произведение на основе данного, то обязаны использовать лицензию исходного произведения или лицензию, совместимую с исходной.
История файла
Нажмите на дату/время, чтобы посмотреть файл, который был загружен в тот момент.
| Дата/время | Миниатюра | Размеры | Участник | Примечание | |
|---|---|---|---|---|---|
| текущий | 00:40, 22 февраля 2023 | | 800 × 600 (49 Кб) | Tga.D | updated data, fixed colors and styles to be more color blind-friendly |
| 16:11, 7 марта 2022 |  | 800 × 600 (37 Кб) | Daemon2010 | Added Fugaku | |
| 06:32, 20 февраля 2019 |  | 800 × 600 (45 Кб) | Tga.D | Increase font size; adjust label positions | |
| 06:15, 20 февраля 2019 |  | 800 × 600 (45 Кб) | Tga.D | Regenerated with a newer version of gnuplot, and more recent TOP500 data. Opted to not update the trendline, as the divergence from expected seems more relevant. | |
| 22:20, 18 июня 2013 |  | 800 × 600 (34 Кб) | Tga.D | New #1 on the TOP 500 June 2013 list. | |
| 01:07, 24 декабря 2012 |  | 800 × 600 (34 Кб) | Tga.D | large mediawiki-generated png versions had messed up spacing in the key, switching the order to see if it fixes it | |
| 00:29, 24 декабря 2012 |  | 800 × 600 (34 Кб) | Tga.D | User created page with UploadWizard |
Использование файла
Следующие 3 страницы используют этот файл:
Глобальное использование файла
Данный файл используется в следующих вики:
- Использование в ar.wikipedia.org
- Использование в bs.wikipedia.org
- Использование в ca.wikipedia.org
- Использование в en.wikipedia.org
- Использование в es.wikipedia.org
- Использование в fa.wikipedia.org
- Использование в fr.wikipedia.org
- Использование в gl.wikipedia.org
- Использование в he.wikipedia.org
- Использование в hu.wikipedia.org
- Использование в id.wikipedia.org
- Использование в ja.wikipedia.org
- Использование в th.wikipedia.org
- Использование в uk.wikipedia.org
- Использование в zh.wikipedia.org