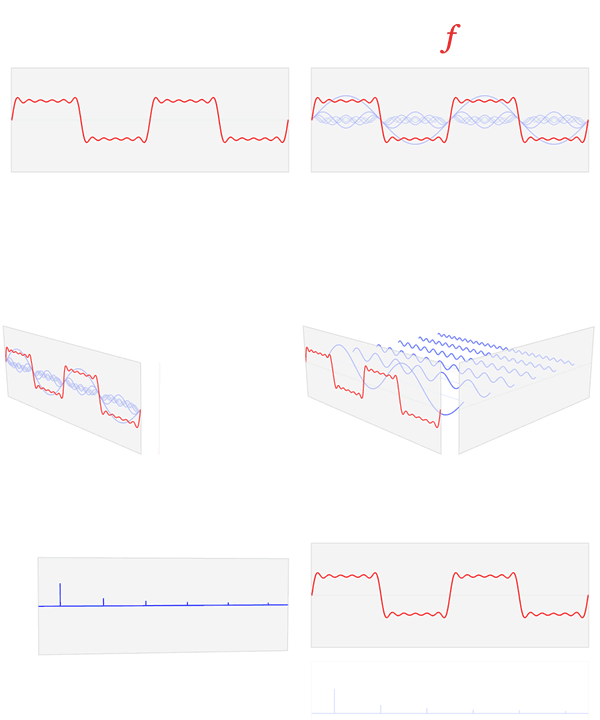
Файл:Fourier transform time and frequency domains.gif
Fourier_transform_time_and_frequency_domains.gif (500 × 400 пкс, размер файла: 399 Кб, MIME-тип: image/gif, закольцованный, 93 фрейма, 37 с)
История файла
Нажмите на дату/время, чтобы посмотреть файл, который был загружен в тот момент.
| Дата/время | Миниатюра | Размеры | Участник | Примечание | |
|---|---|---|---|---|---|
| текущий | 20:42, 23 февраля 2013 |  | 500 × 400 (399 Кб) | LucasVB | Reverted to version as of 20:31, 23 February 2013 |
| 20:38, 23 февраля 2013 |  | 500 × 400 (684 Кб) | LucasVB | Trying to circumvent MediaWiki's crappy thumbnail generator again. Completely unoptimized the animation. | |
| 20:31, 23 февраля 2013 |  | 500 × 400 (399 Кб) | LucasVB | The new GIF scaling algorithm used on MediaWiki is awful, and adds a bunch of horrible artifacts to the animated thumbs. This is an attempt at avoiding the artifacts using an alternate palette. If this doesn't work, I'll have to submit the smaller vers... | |
| 11:43, 23 февраля 2013 |  | 500 × 400 (346 Кб) | LucasVB | {{Information |Description=A visualization of the relationship between the time domain and the frequency domain of a function, based on its Fourier transform. |Source={{own}} |Date=2013-02-23 |Author= Lucas V. Barbosa |Permission={{PD-... |
Использование файла
Следующая страница использует этот файл:
Глобальное использование файла
Данный файл используется в следующих вики:
- Использование в ar.wikipedia.org
- Использование в bn.wikipedia.org
- Использование в en.wikipedia.org
- Использование в en.wikiversity.org
- Использование в eu.wikipedia.org
- Использование в fr.wikipedia.org
- Использование в hi.wikipedia.org
- Использование в www.wikidata.org

