Файл:Supercomputers-history.svg

Размер этого PNG-превью для исходного SVG-файла: 160 × 120 пкс. Другие разрешения: 320 × 240 пкс | 640 × 480 пкс | 1024 × 768 пкс | 1280 × 960 пкс | 2560 × 1920 пкс.
Исходный файл (SVG-файл, номинально 160 × 120 пкс, размер файла: 16 Кб)
Этот файл находится на Викискладе. Сведения о нём показаны ниже.
Викисклад — централизованное хранилище для свободных файлов, используемых в проектах Викимедиа.
|
Краткое описание
| Описание |
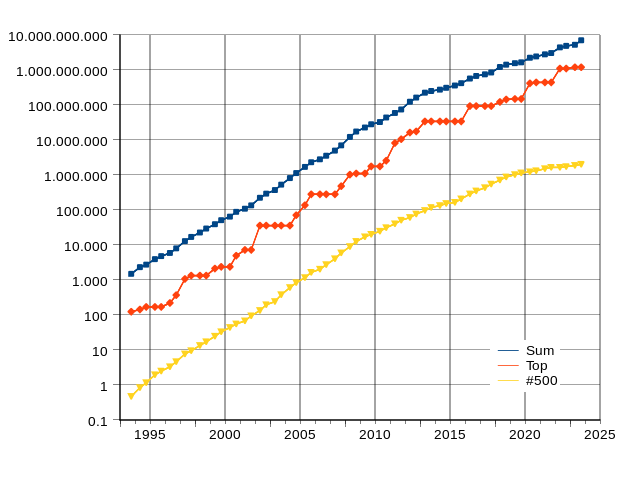
English: Exponential growth of supercomputers performance, based on data from top500.org site. Y Axis shows performance in logarithmic scale in GFLOPS.
Combined performance of 500 largest supercomputers Fastest supercomputer
Supercomputer on 500th place
Polski: Wykładniczy wzrost mocy obliczeniowej superkomputerów, na podstawie danych ze strony top500.org. Na osi Y pokazana jest moc obliczeniowa w GFLOPS w skali logarytmicznej
Suma mocy obliczeniowej 500 najszybszych superkomputerów Najszybszy superkomputer
Superkomputer na 500 miejscu
Deutsch: Exponentielles Wachstum der Supercomputerleistung, basierend auf den Daten der top500.org-Site. Die y-Achse zeigt die Leistung in GFLOPS.
Die dunkelblaue Linie stellt die Gesamtsumme der Rechengeschwindigkeit aller Supercomputer der Plätze 1 bis 500 der TOP500-Liste dar. Die rote Linie stellt die Geschwindigkeit des schnellsten Supercomputers auf Platz 1 der TOP500-Liste dar.
Die gelbe Linie stellt die Geschwindigkeit des Supercomputers auf Platz 500 der TOP500-Liste dar.
Español: El crecimiento geométrico de los resultados de supercomputadoras, sobre la base de datos del sitio top500.org. El eje Y muestra la productividad en GFLOPS. La línea roja indica el superordenador más rápido del mundo en ese momento. La línea amarilla denota superordenador Nº 500 en la lista TOP500. La línea azul oscuro denota el rendimiento total combinado de las supercomputadoras de la lista TOP500.
Русский: Геометрическое представление роста производительности суперкомпьютеров по данным сайта top500.org. Ось Y отображает производительность в гигафлопсах, ось Х — дату.
Красная линия — производительность самого быстрого суперкомпьютера в мире на заданный момент времени. Жёлтая линия — производительность суперкомпьютера на 500 месте в списке TOP500. Синяя линия — суммарная производительность суперкомпьютеров в списке TOP500. |
| Дата | |
| Источник | Собственная работа |
| Автор | AI.Graphic |
Generated with Wikimedia SVG Chart
| Data format | The source data of the chart is in the SVG image file in a clearly readable format. You see the original numbers inside of the SVG file in the form of a list such as this:
... 1995 10.06 1996 11.75 1997 12.45 ... |
| Content of SVG | To view the data download the SVG file itself. To do so right-click this link, and then choose the option to save: File:Supercomputers-history.svg. Launch any text editor. Open the downloaded SVG file with the text editor (usually; file menu, open). To see the list of data, search for the phrase id="graph1". |
| Please, do not use a special SVG editor such as Inkscape; the readability of the database would be destroyed. You can edit the SVG file with any text editor, for example; en: List of text editors. You can view the edited SVG file in various web browsers. As of 2011, all major desktop browsers, and many minor ones, have some level of SVG support. See: en: Scalable Vector Graphics#Support for SVG in web browsers. When satisfied with your edits, upload the edited SVG file with the link labeled "Upload a new version of this file".
W3C-validity not checked. This chart was created with Wikimedia SVG Chart. Этот файл использует встроенный текст/цифры. |
|
| Code to generate SVG | See: File talk:Supercomputers-history.svg. Documentation see: Wikimedia SVG Chart. |
top500 original version: https://www.top500.org/statistics/perfdevel/ data is embedded into html code
Data:
Date	First	Last	Sum
1993-06-01	59.7	0.42	1122.85
1993-11-01	124	0.47	1493.35
1994-06-01	143.4	0.84	2317.01
1994-11-01	170	1.16	2732.24
1995-06-01	170	1.96	3927
1995-11-01	170	2.49	4784.34
1996-06-01	220.4	3.31	5892.24
1996-11-01	368.2	4.62	7981.24
1997-06-01	1068	7.67	12844.19
1997-11-01	1338	9.51	16898.12
1998-06-01	1338	13.39	22625.14
1998-11-01	1338	17.12	29367.6
1999-06-01	2121	24.7	39062.57
1999-11-01	2379	33.09	50938.56
2000-06-01	2379	43.82	64230.11
2000-11-01	4938	55.3	88082.45
2001-06-01	7226	67.78	108276.78
2001-11-01	7226	94.3	134977.51
2002-06-01	35860	134.3	222263.77
2002-11-01	35860	195.8	291814.16
2003-06-01	35860	241.4	370049.26
2003-11-01	35860	378.6	526740.41
2004-06-01	35860	606.9	812313.21
2004-11-01	70720	840.02	1128834.52
2005-06-01	136800	1166	1694886.64
2005-11-01	280600	1645.7	2299341.68
2006-06-01	280600	2026	2789465.47
2006-11-01	280600	2736.9	3527867.61
2007-06-01	280600	4031	4950600.48
2007-11-01	478200	5937.33	6977593.51
2008-06-01	1026000	8996.78	12152691.08
2008-11-01	1105000	12593.5	17373520.05
2009-06-01	1105000	17110	22640789.57
2009-11-01	1759000	20070	28006450.09
2010-06-01	1759000	24670	32434684.56
2010-11-01	2566000	31124.36	43786881.73
2011-06-01	8162000	40187.29	58930025.84
2011-11-01	10510000	50941.4	74069633.68
2012-06-01	16324751	60824.4	123417786.71
2012-11-01	17590000	76411	162139386.75
2013-06-01	33862700	96619	223654338.13
2013-11-01	33862700	117831.3	250080467.17
2014-06-01	33862700	133700	273763781.09
2014-11-01	33862700	152912.09	308166151.08
2015-06-01	33862700	164559	359296049.36
2015-11-01	33862700	206304	417807043.6
2016-06-01	93014593.88	286100	567353038.81
2016-11-01	93014593.88	349333	672112377.49
2017-06-01	93014593.88	432200	748700301.81
2017-11-01	93014593.88	548672	845120504.67
2018-06-01	122300000	715551	1210914864.08
2018-11-01	143500000	874100	1414042521.78
2019-06-01     148600000       1021000 1559575380
2019-11-01     148600000       1142000 1646887143
2020-06-01     415530000       1228000 2230000000
2020-11-01     442010000       1316840 2428761851
2021-06-01     442010000       1511000 2786058800
2021-11-01     442010000       1649110	3036861784
2022-06-01     1102000000       1649110	4403083214
2022-11-01     1102000000       1729000	4864384416
2023-06-01     1194000000       1872000	5239024665.77
2023-11-01     1194000000       2015000	7031841465.77
Лицензирование
Я, владелец авторских прав на это произведение, добровольно публикую его на условиях следующей лицензии:
Этот файл доступен по лицензии Creative Commons Attribution-Share Alike 3.0 Unported.
- Вы можете свободно:
- делиться произведением – копировать, распространять и передавать данное произведение
- создавать производные – переделывать данное произведение
- При соблюдении следующих условий:
- атрибуция – Вы должны указать авторство, предоставить ссылку на лицензию и указать, внёс ли автор какие-либо изменения. Это можно сделать любым разумным способом, но не создавая впечатление, что лицензиат поддерживает вас или использование вами данного произведения.
- распространение на тех же условиях – Если вы изменяете, преобразуете или создаёте иное произведение на основе данного, то обязаны использовать лицензию исходного произведения или лицензию, совместимую с исходной.
История файла
Нажмите на дату/время, чтобы посмотреть файл, который был загружен в тот момент.
| Дата/время | Миниатюра | Размеры | Участник | Примечание | |
|---|---|---|---|---|---|
| текущий | 23:30, 4 февраля 2024 | | 160 × 120 (16 Кб) | Wiklol | update of value |
| 12:08, 28 февраля 2023 |  | 160 × 120 (16 Кб) | Mik | reduced size, which fixed problems with text positions, but default look is quite small | |
| 11:02, 28 февраля 2023 |  | 800 × 600 (16 Кб) | Mik | fixed proportions | |
| 17:07, 27 февраля 2023 |  | 800 × 600 (16 Кб) | Mik | removed tspans, hopefully fixing text alignment problems at different scales | |
| 13:40, 6 июля 2021 |  | 800 × 600 (17 Кб) | Dsfarcturus | applied white background to entire image, adjusted viewbox | |
| 13:24, 6 июля 2021 |  | 800 × 600 (17 Кб) | Dsfarcturus | Added November 2020 and June 2021 statitics, lengthened X axis and moved legend | |
| 19:03, 29 ноября 2020 |  | 800 × 600 (17 Кб) | AntwortenBaer | Added decimal points to y axis | |
| 06:49, 5 августа 2020 |  | 800 × 600 (17 Кб) | JFG | Updated with data for June 2019, November 2019 and June 2020 | |
| 14:16, 14 ноября 2018 |  | 800 × 600 (17 Кб) | Dsfarcturus | Added November 2018 data and fixed date plot discrepancies. | |
| 12:31, 29 июня 2018 |  | 800 × 600 (17 Кб) | Dsfarcturus | Added June 2018 data |
Использование файла
Следующие 2 страницы используют этот файл:
Глобальное использование файла
Данный файл используется в следующих вики:
- Использование в ar.wikipedia.org
- Использование в bg.wikipedia.org
- Использование в ca.wikipedia.org
- Использование в de.wikipedia.org
- Использование в en.wikipedia.org
- Использование в es.wikipedia.org
- Использование в fi.wikipedia.org
- Использование в he.wikipedia.org
- Использование в hu.wikipedia.org
- Использование в it.wikipedia.org
- Использование в ja.wikipedia.org
- Использование в pl.wikipedia.org
- Использование в tr.wikipedia.org
- Использование в uk.wikipedia.org
- Использование в zh.wikipedia.org