Файл:Temp-sunspot-co2.svg

Размер этого PNG-превью для исходного SVG-файла: 720 × 540 пкс. Другие разрешения: 320 × 240 пкс | 640 × 480 пкс | 1024 × 768 пкс | 1280 × 960 пкс | 2560 × 1920 пкс.
Исходный файл (SVG-файл, номинально 720 × 540 пкс, размер файла: 98 Кб)
Этот файл находится на Викискладе. Сведения о нём показаны ниже.
Викисклад — централизованное хранилище для свободных файлов, используемых в проектах Викимедиа.
|
Краткое описание
| Описание |
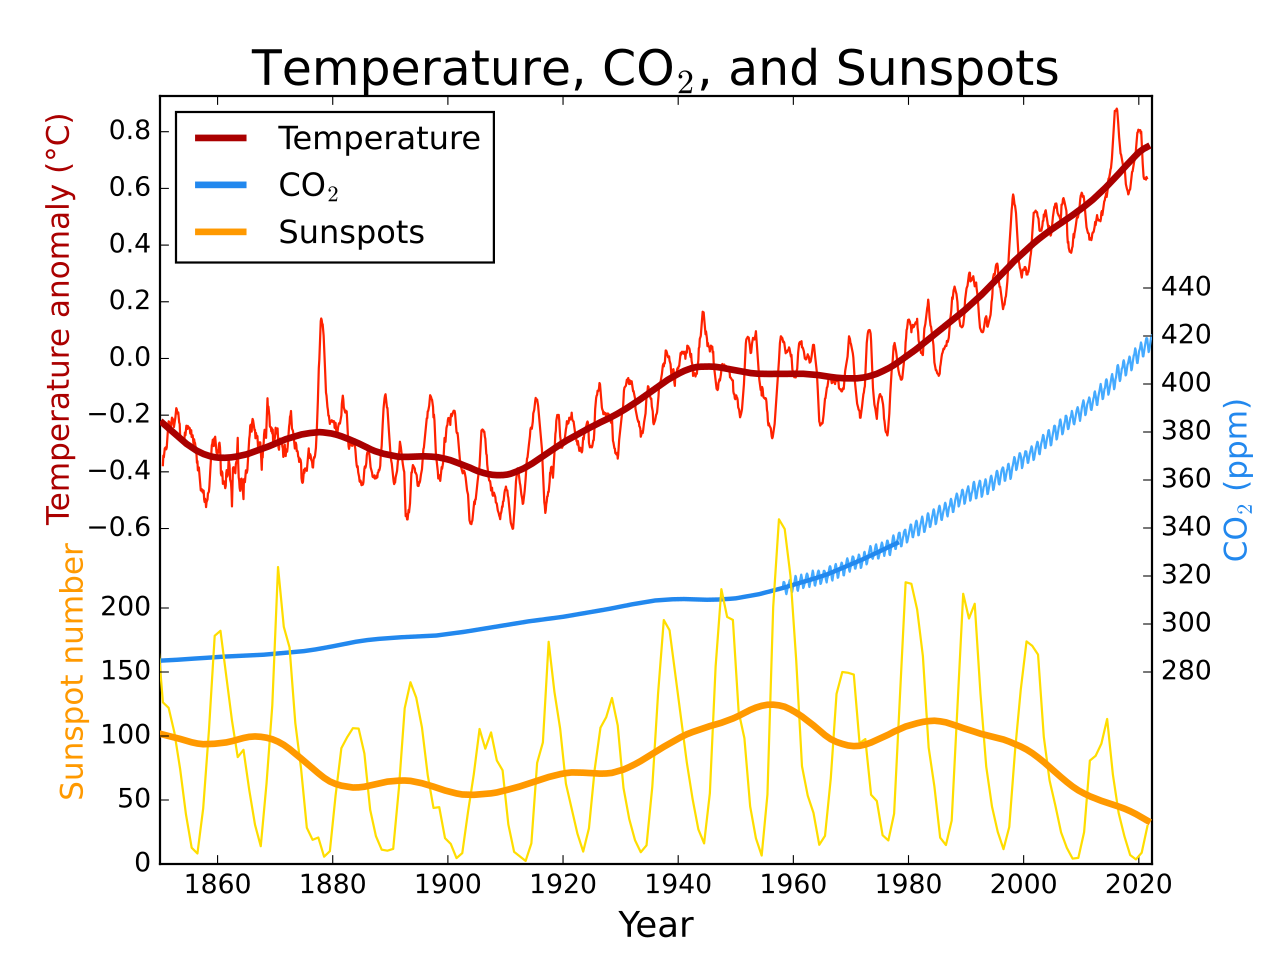
English: Global average temperature, atmospheric CO2, and sunspot activity since 1850. Thick lines for temperature and sunspots represent a 25 year LOWESS and moving average smoothing of the raw data. |
||
| Дата | 11 января 2009 (дата первоначальной загрузки файла на вики) | ||
| Источник | Перенесено с en.wikipedia на Викисклад участником Anrie при помощи CommonsHelper. | ||
| Автор | Leland McInnes из английский Википедия | ||
| Другие версии |
|
||
| SVG‑разработка | Исходный код этого SVG-файла некорректен из-за ошибки. Это diagram было создано с помощью Matplotlib
Global average temperature, atmospheric CO2, and sunspot activity since 1850. Thick lines for temperature and sunspots represent a 25 year moving average smoothing of the raw data. This figure was produced by Leland McInnes using python and matplotlib and is licensed under the GFDL. All data is from publicly available sources.
| ||
| Исходный код | Python code#! /usr/bin/env python3
# -*- coding: utf-8 -*-
import numpy as np
import matplotlib.pylab as plt
import matplotlib.ticker as ticker
import urllib3
import ftplib
import shutil
plt.rcdefaults()
plt.style.use('classic')
def saveurl(url, fname):
if url.startswith("ftp"):
ftp = ftplib.FTP('/'.join(url.split('/')[2:3]))
ftp.login('', '')
with open(fname, 'wb') as f:
res = ftp.retrbinary('RETR %s' % '/'.join(url.split('/')[3:]), f.write)
else:
c = urllib3.PoolManager()
with c.request('GET', url, preload_content=False) as resp, open(fname, 'wb') as out_file:
shutil.copyfileobj(resp, out_file)
print('saved', fname, 'from', url)
def smooth_convolution(signal, window_size):
window_size = 1 + 2 * (window_size // 2) # should be odd
w = np.hamming(window_size)
y = (np.convolve(w, signal) / np.convolve(w, np.ones_like(signal)))
return y[(len(w)-1)//2:-(len(w)//2)]
def smooth_lowess(signal, window_size):
s = window_size // 2
window = np.hamming(1+2*s) / np.hamming(1+2*s).sum()
smoothed = np.empty_like(signal)
for i in range(len(signal)):
i0, i1 = max(i-s, 0), min(i+s, len(signal)-1) + 1
# linear LOWESS smoothing
smoothed[i] = np.poly1d(np.polyfit(np.arange(i0, i1), signal[i0:i1], deg=1,
w=np.sqrt(window[i0-i+s:i1-i+s])))(i)
return smoothed
saveurl("http://woodfortrees.org/data/hadcrut4gl/mean:12", "hadcrut4gl.txt")
with open("hadcrut4gl.txt") as temp_file:
temp_years, temps = [], []
for l in temp_file.readlines():
yT = l.split()
if (not l.startswith('#')) and len(yT) == 2:
temp_years.append(float(yT[0]))
temps.append(float(yT[1]))
#print('T', list(zip(temp_years, temps)))
saveurl("ftp://aftp.cmdl.noaa.gov/products/trends/co2/co2_mm_mlo.txt", "co2_mm_mlo.dat")
with open("co2_mm_mlo.dat") as co2_file:
data_rows = [x.split() for x in co2_file if not x.startswith("#") and x.find("-99.99") == -1]
co2_years = [float(x[2]) for x in data_rows]
co2concs = [float(x[3]) for x in data_rows]
#print('co2', list(zip(co2_years, co2concs)))
saveurl("ftp://ftp.ncdc.noaa.gov/pub/data/paleo/icecore/antarctica/law/law_co2.txt", "law_co2.txt")
with open("law_co2.txt", encoding="ISO-8859-1") as lawco2_file:
data_rows = [x.split() for x in lawco2_file if x.startswith(" 1")]
del data_rows[ [float(x[0]) for x in data_rows].index(1010.):]
lawco2_years = [float(x[0]) for x in data_rows]
lawco2concs = [float(x[-1]) for x in data_rows]
#print('lawco2', list(zip(lawco2_years, lawco2concs)))
saveurl("http://www.sidc.be/silso/DATA/SN_y_tot_V2.0.txt", "yearssn.dat")
with open("yearssn.dat") as sunspot_file:
data_rows = [x.split() for x in sunspot_file if "*" not in x]
sun_years = [float(x[0]) for x in data_rows]
sunspots = [float(x[1]) for x in data_rows]
#print('sunspots', list(zip(sun_years, sunspots)))
t_min, t_max = 1850, max(temp_years[-1], co2_years[-1], sun_years[-1])
smoothed_temps = smooth_lowess(temps, 25 * 12)
smoothed_sunspots = smooth_convolution(sunspots, 25)
rect = [0.125, 0.1, 0.775, 0.8]
base_ax = plt.axes(rect)
base_ax.yaxis.tick_left()
plt.yticks([])
plt.xlim(t_min, t_max)
plt.gca().xaxis.set_major_locator(ticker.MultipleLocator(20))
plt.xlabel("Year", size=16)
plt.title(r"Temperature, CO$_2$, and Sunspots", size=22)
temp_ax = plt.axes([rect[0],rect[1]+.42*rect[3],rect[2],.58*rect[3]], frameon=False)
temp_ax.yaxis.tick_left()
plt.plot(temp_years, temps, '#FF2200')
tline = plt.plot(temp_years, smoothed_temps, '#AA0000', lw=3)
plt.xlim(t_min, t_max)
plt.ylim(min(temps)*1.03 - 0.03*max(temps), max(temps)*1.03 - 0.03*min(temps))
plt.yticks(np.arange(-0.6,0.9,0.2))
plt.ylabel(u'Temperature anomaly (°C)', size=14, color='#AA0000')
plt.xticks([])
co2_ax = plt.axes([rect[0],rect[1]+.25*rect[3],rect[2],.5*rect[3]], frameon=False)
co2_ax.yaxis.tick_right()
co2_ax.yaxis.set_label_position("right")
co2_ax.xaxis.tick_bottom()
plt.plot(co2_years, co2concs, '#44AAFF')
cline = plt.plot(lawco2_years, lawco2concs, '#2288EE', lw=2)
plt.xlim(t_min, t_max)
plt.ylabel(r'CO$_2$ (ppm)', size=14, color='#2288EE')
plt.xticks([])
sun_ax = plt.axes([rect[0],rect[1],rect[2],.5*rect[3]], frameon=False)
sun_ax.yaxis.tick_left()
plt.plot(sun_years, sunspots, "#FFDD00")
sline = plt.plot(sun_years, smoothed_sunspots, "#FF9900", lw=3)
plt.xlim(t_min, t_max)
plt.yticks(np.arange(0,250,50))
plt.ylabel("Sunspot number", size=14, color='#FF9900')
plt.xticks([])
plt.sca(base_ax)
t_proxy = plt.Line2D([0], [0], c='#AA0000', lw=3)
c_proxy = plt.Line2D([0], [0], c='#2288EE', lw=3)
s_proxy = plt.Line2D([0], [0], c='#FF9900', lw=3)
plt.legend((t_proxy, c_proxy, s_proxy), ("Temperature", r"CO$_2$", "Sunspots"), loc="upper left")
plt.savefig("Temp-co2-sunspot.svg")
plt.show()
|


Related Images


Лицензирование
Leland McInnes из английской Википедии, владелец авторских прав на это произведение, добровольно публикует его на условиях следующей лицензии:
| Этот файл доступен по лицензии Creative Commons Attribution-Share Alike 3.0 Unported. Также налагаются дополнительные ограничения. | ||
| Атрибуция: Leland McInnes из английской Википедии | ||
| ||
| Этот признак лицензирования был добавлен к этому файлу как часть обновления лицензии GFDL. |

|
Разрешается копировать, распространять и/или изменять этот документ в соответствии с условиями GNU Free Documentation License версии 1.2 или более поздней, опубликованной Фондом свободного программного обеспечения, без неизменяемых разделов, без текстов, помещаемых на первой и последней обложке. Копия лицензии включена в раздел, озаглавленный GNU Free Documentation License. Также налагаются дополнительные ограничения. |
Исходный журнал загрузок
Первоначальная страница описания находилась здесь. Все нижеперечисленные имена участников относятся к en.wikipedia.
- 2009-01-11 03:45 Leland McInnes 720×540× (102750 bytes)
- 2008-10-09 00:57 Leland McInnes 600×480× (34962 bytes)
- 2007-03-11 02:47 Leland McInnes 600×480× (48910 bytes) Fix for wrong data selection
- 2007-03-11 02:10 Leland McInnes 600×480× (48672 bytes) Update to Had CRUT3 instead of CRUTEM
- 2007-03-10 20:46 Leland McInnes 600×480× (48525 bytes)
- 2007-03-10 20:41 Leland McInnes 600×480× (47761 bytes)
- 2007-03-10 05:01 Leland McInnes 600×480× (33704 bytes) Global average temperature, Mauna Loa CO<sub>2</sub>, and sunspot activity for the last 50 years.
История файла
Нажмите на дату/время, чтобы посмотреть файл, который был загружен в тот момент.
| Дата/время | Миниатюра | Размеры | Участник | Примечание | |
|---|---|---|---|---|---|
| текущий | 20:23, 30 мая 2022 | | 720 × 540 (98 Кб) | Geek3 | update 2022-04 |
| 13:11, 9 апреля 2021 |  | 720 × 540 (106 Кб) | Geek3 | update 2021-04 | |
| 13:04, 26 июня 2020 |  | 720 × 540 (105 Кб) | Geek3 | data update 2020-05, enlarge temperature y-axis | |
| 15:10, 6 марта 2020 |  | 720 × 540 (107 Кб) | Geek3 | update with 2020 data | |
| 22:15, 22 июня 2014 |  | 720 × 540 (76 Кб) | Kopiersperre | switch from hadcrut3 to hadcrut4 | |
| 20:27, 11 марта 2014 |  | 720 × 540 (62 Кб) | Kopiersperre | update | |
| 21:04, 25 июня 2012 |  | 731 × 551 (75 Кб) | Johnanth | New version pulled from file discussion, based on the newly updated Python script. | |
| 18:38, 20 июня 2011 |  | 731 × 551 (69 Кб) | Killiondude | http://m8y.org/tmp/wikipedia/ Someone was kind enough to use updated stats and redo it. | |
| 12:10, 4 мая 2009 |  | 720 × 540 (100 Кб) | File Upload Bot (Magnus Manske) | {{BotMoveToCommons|en.wikipedia|year={{subst:CURRENTYEAR}}|month={{subst:CURRENTMONTHNAME}}|day={{subst:CURRENTDAY}}}} {{Information |Description={{en|__NOTOC__ Global average temperature, atmospheric CO<sub>2</sub>, and sunspot activity since 1850. Thi |
Использование файла
Следующие 2 страницы используют этот файл:
Глобальное использование файла
Данный файл используется в следующих вики:
- Использование в be.wikipedia.org
- Использование в bn.wikipedia.org
- Использование в ca.wikipedia.org
- Использование в de.wikipedia.org
- Использование в en.wikipedia.org
- Использование в en.wikiversity.org
- Использование в es.wikipedia.org
- Использование в fa.wikipedia.org
- Использование в fr.wikipedia.org
- Использование в hu.wikipedia.org
- Использование в ig.wikipedia.org
- Использование в it.wikipedia.org
- Использование в ko.wikipedia.org
- Использование в pt.wikipedia.org
- Использование в sr.wikipedia.org
- Использование в tr.wikipedia.org
- Использование в uk.wikipedia.org
- Использование в zh.wikipedia.org